

1. Reflection Statement on Project Benefits
This project aims to analyze and predict whether a customer will open a term deposit following a telemarketing campaign [1]. Through this analysis, we can identify the most effective marketing strategies employed by the bank to convert marketing calls into term deposits. Key insights include determining critical factors influencing customer decisions, identifying behavioral patterns among specific customer segments, and conducting time-series analysis of sales trends and customer preferences for different banking products.
Such insights, once derived and analyzed, can significantly enhance the bank's market reach, increase revenue, and maintain competitive advantages. Additionally, these findings enable the bank to achieve business goals and simultaneously benefit customers by allowing the creation of tailored products aligned with customer preferences. Although detailed behavioral analysis lies outside the project's current scope, the analysis performed here provides valuable insights into model performance and reveals general data feature patterns available for further exploration.
2. Abstract
Telemarketing enables businesses to expand customer reach by directly interacting with them and informing them about new products and services, ultimately aiming to boost revenue. Analyzing telemarketing campaign success rates helps businesses identify the strengths and weaknesses of their marketing strategies. Such insights allow companies to proactively develop products tailored to customer preferences. Additionally, predicting the success rate of marketing campaigns, specifically whether customers will open term deposits post-campaign, allows businesses to simulate campaign outcomes using historical data, significantly reducing resource expenditures associated with real campaigns.
This project involves comprehensive exploratory data analysis and the development of multiple machine learning models to predict campaign outcomes. It includes refining these models to enhance prediction accuracy and conducting detailed analyses to identify key features most influential in driving successful predictions.
3. Introduction
Marketing campaigns significantly enhance business performance. Companies utilize diverse marketing approaches with various communication methods, among which telephone marketing, or telemarketing, is particularly prevalent. Telemarketing involves direct communication with customers via telephone, capturing detailed data about customer interactions and sales executive engagements. These data features typically include customer historical behavior, campaign-related details, and customer demographic information.
Analyzing marketing campaign outcomes enables companies to optimize their portfolios and improve the efficiency of their strategies. For this analysis, I utilized a dataset containing telemarketing records from a Portuguese bank, including an output variable indicating whether customers purchased a long-term deposit. This study treats the problem as a binary classification task using the dataset’s 'y' flag variable, which denotes customers’ decisions about buying long-term deposits. The dataset [1] contains 45,211 instances with 17 multivariate features and exhibits a class distribution imbalance of 1 positive to every 7 negative instances.
The predictive modeling approach undertaken involved several key steps: data analysis, data cleaning and preparation, data splitting, model selection, model training, model tuning, and performance evaluation.
Initially, descriptive statistics and data visualization techniques facilitated exploratory data analysis, allowing the identification and removal of null or outlier values. Following data cleaning, categorical variables were converted to dummy variables due to their ordinal nature. The dataset was then randomly divided into training and testing sets using a 70:30 ratio, applying stratified sampling to maintain the original class distribution in both subsets.
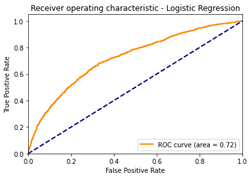
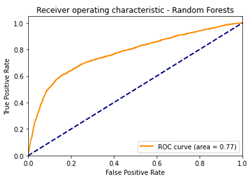
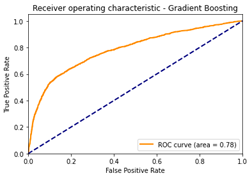
In the modeling phase, three machine learning models were evaluated—Logistic Regression (LR), Random Forest Classifier (RFC), and Gradient Boosting Classifier (GBC). Among these, the Gradient Boosting Classifier demonstrated the best performance, assessed by the Area Under the Receiver Operating Characteristic Curve (AUC ROC), which effectively measures the model’s sensitivity and specificity at various classification thresholds. Using the AUC score for model evaluation, I applied the Randomized Search tuning strategy with three-fold cross-validation to optimize the Gradient Boosting Classifier. This method efficiently searches for the best model hyperparameters without exhaustively evaluating all possible combinations. Post-tuning, the GBC achieved a predictive accuracy of 89% and an AUC score of 78%. Further sections detail each of these steps comprehensively.
4. Literature Survey
I referred to a research paper [2] detailing an approach used to tackle the binary classification problem of predicting customer decisions to purchase long-term deposits from a bank. The authors of this paper analyzed and developed predictive models using richer and more extensive time-series data.
The researchers trained four distinct models and reported their findings for each. The data, collected from a Portuguese bank between 2008 and 2013, originally comprised 150 features that included details about bank clients, products, and socio-economic conditions. These features were reduced to 22 using a semi-automatic feature selection method. The dataset was divided into training and testing subsets based on timestamps; data from 2008 to early 2012 were employed to train the models, while data from July 2012 to 2013 served to evaluate the models' predictive accuracy. Performance evaluation utilized the Area Under the Curve (AUC) and the Area under the LIFT curve (ALIFT) scores. The ALIFT metric specifically measures the churn rate of users relative to the model’s classification threshold.
The four models examined included Logistic Regression (LR), Decision Tree (DT), Neural Network (NN), and Support Vector Machine (SVM). Among these, the Neural Network emerged as the top-performing model, achieving an AUC score of 0.8 (80%) and an ALIFT score of 0.7.
Additionally, the authors applied two knowledge extraction techniques—sensitivity analysis and Decision Trees—to identify key attributes influencing the Neural Network model’s predictions. Their analysis concluded that the Neural Network model produced credible and valuable insights, offering practical inputs for telemarketing campaign managers.
5. Project Methodology
Dataset Overview
The dataset comprises 45,211 records with 17 multivariate features [1], including categorical, integer, and floating-point data types. It contains detailed information on bank clients, contact records from previous campaigns, data from the current campaign, and the corresponding outcome variable. The dataset features include:
| FEATURE | DESCRIPTION |
|---|---|
| Age (Numeric) | Age of the client |
| Job (Categorical) | Job position of the client |
| Marital (Categorical) | Marital status of the client |
| Education (Categorical) | Education level of the client |
| Default (Categorical) | If the client has any credit in default |
| Housing (Categorical) | If the client has a housing loan |
| Loan (Categorical) | If the client has a personal loan |
| Contact (Categorical) | Client communication mode |
| Month (Categorical) | Month of contact |
| Day_Of_Week (Numeric) | Date of contact |
| Campaign (Numeric) | Number of times the client has been contacted during this campaign |
| Balance (Numeric) | Average yearly balance of the client, in Euros |
| Pdays (Numeric) | Number of days since the client has been contacted during the last campaign |
| Previous (Numeric) | Number of times the client has been contacted before this campaign |
| Poutcome (Categorical) | Outcome of the previous campaign |
| Y (Categorical) | Output variable with ‘yes’ and ‘no’ as levels |
Given that the dataset used in this project is a subset of the original and lacks adequate temporal data to support a time-series analysis, I approached it as a conventional machine learning problem using individual samples. The project is structured into three main phases: data analysis, modeling, and model evaluation and analysis.
In the Data Analysis phase, I conducted a comprehensive exploration and preparation of the dataset to ensure its readiness for modeling. I utilized descriptive statistics and data visualization techniques to identify patterns and insights within the data. To handle missing data, I excluded columns containing more than 50% null values, as they provided limited predictive value.
Following data cleaning, I applied one-hot encoding to categorical variables to maintain their ordinal nature. One-hot encoding converts each categorical variable into multiple binary indicator variables, each representing a unique category. While this method increases the dataset’s memory requirements, it is essential to retain the variables' ordinal characteristics. Additionally, I introduced a new variable categorizing the 'day_of_week' into 'first,' 'second,' 'third,' or 'fourth' week segments based on seven-day intervals.
Once the dataset preparation was complete, I divided the data into training and testing subsets using stratified sampling at a 70:30 ratio. Stratified sampling was necessary due to the significant imbalance in the output variable 'y,' with only one positive instance for every seven negative instances below image. This approach ensured that both subsets accurately reflected the original class distribution, enabling robust model training and evaluation.
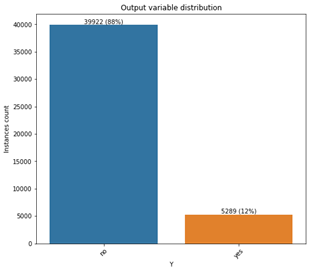
Stratified sampling was utilized to maintain the original ratio of positive and negative classes (12:88) within both the training and testing datasets. Following this, I trained three machine learning classification algorithms—Logistic Regression (LR), Random Forest Classifier (RFC), and Gradient Boosting Classifier (GBC)—using their default hyperparameters. Hyperparameters are algorithm-specific settings that can be tuned to optimize various model performance metrics such as specificity, sensitivity, and accuracy. Initially, the models were trained using default settings to identify the most promising candidate for further tuning, primarily to optimize resources and reduce computation time. Among these models, GBC achieved the highest performance, yielding an Area Under the Receiver Operating Characteristic Curve (AUC) score of 78%.
RandomizedSearchCV(
cv=3,
estimator=GradientBoostingClassfier(), n_jobs=-1,
param_distributions={
'learning_rate': [0.1,0.5,0.01],
'loss': ['deviance','exponential'],
'max_depth': [5,7,9,11,13],
'min_samples_split': [2,3,5,7,9]
'n_estimators': [100,200,300,400,500,600]
},
random_state=42
)
Subsequently, I prepared a hyperparameter tuning grid specifically for the GBC model and employed the Randomized Search tuning approach combined with Cross-Validation (RSCV). This approach involves randomly selecting subsets of hyperparameters from the provided grid, assessing each subset's impact on accuracy improvement, and terminating when significant improvement ceases across iterations. RSCV optimizes resource usage by quickly finding a near-optimal model without exhaustively evaluating every parameter combination. Cross-validation further validates model accuracy by partitioning the training data into equal segments ('folds'), which are interchangeably used for training and testing during the tuning process.
The optimized hyperparameters identified for the GBC model are summarized below
| HYPERPARAMETER | DESCRIPTION |
|---|---|
| n_estimators | Number of boosting stages to perform |
| min_samples_split | Minimum number of samples required to split at internal nodes |
| max_depth | Maximum depth of each regression estimator |
| loss | The loss function that is to be optimized to train the model |
| learning_rate | This shrinks the contribution of each tree by learning_rate |
Post-tuning, all models were evaluated using ROC curves, AUC scores, Precision, and Recall metrics. Precision measures the proportion of correctly predicted positive instances out of all positive predictions, while Recall indicates the proportion of correctly predicted positive instances out of all actual positive cases in the test set. The performance comparisons of the models are presented in Figures 4, 5, and 6, highlighting the ROC curves and corresponding AUC scores for LR, RFC, and GBC, respectively.
Upon reviewing the AUC scores before selecting the Gradient Boosting Classifier (GBC) as the best-performing model, the improvements observed after hyperparameter tuning are presented below:
| Class | Precision | Recall | F1-Score | Support |
|---|---|---|---|---|
| 0 | 0.90 | 0.98 | 0.94 | 11,977 |
| 1 | 0.58 | 0.21 | 0.31 | 1,587 |
| Accuracy: 0.89 | ||||
| Macro Avg | 0.74 | 0.60 | 0.63 | 13,564 |
| Weighted Avg | 0.87 | 0.89 | 0.87 | 13,564 |
| Class | Precision | Recall | F1-Score | Support |
|---|---|---|---|---|
| 0 | 0.90 | 0.98 | 0.94 | 11,977 |
| 1 | 0.59 | 0.16 | 0.26 | 1,587 |
| Accuracy: 0.89 | ||||
| Macro Avg | 0.74 | 0.57 | 0.60 | 13,564 |
| Weighted Avg | 0.86 | 0.89 | 0.86 | 13,564 |
While overall accuracy and the F1-Score did not significantly improve, there was a noticeable enhancement in Recall for the positive class within the tuned model. The F1-score represents the harmonic mean of precision and recall, balancing both metrics. Precision measures the proportion of correctly predicted positive instances among all positive predictions, whereas Recall (Sensitivity) measures the proportion of correctly identified positive instances out of all actual positive cases. Specificity refers to the correct identification of negative instances. Although the observed improvement in Recall is modest, it is crucial given the limited number of positive instances in the dataset.
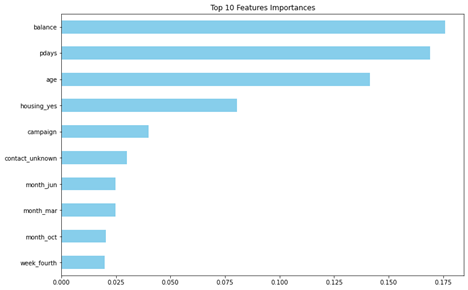
Finally, I analyzed the tuned GBC model further to extract and identify its most influential features in their one-hot-encoded forms, as illustrated below.
6. Case Study
As part of this case study, I conducted a thorough model analysis, and below are the key findings:
- • Balance – Customers with account balances greater than 0 but less than 5,000, as well as those with balances equal to or greater than 10,000, demonstrate a higher likelihood of opening term deposits based on actual data labels.
- • PDays – Customers whose previous contact occurred around days 100, 200, or 400 are more inclined to open term deposits.
- • Age – An observed inconsistency is noted for customers aged between 65 and 70, indicating potential misinformation or data misclassification in this range.
- • Campaign – The model struggles to interpret the 'Campaign' feature effectively, resulting in multiple misclassifications. The importance attributed to this feature appears predominantly associated with identifying negative instances.
- • Contact – The model accurately captured most information provided in the 'Contact' field, although it generated some false-positive predictions.
- • Month – The model exhibited shortcomings in correctly interpreting data from instances occurring in March, October, and September, indicating a failure to leverage information effectively from these months.
7. Results
Definitions:
| METRIC | DESCRIPTION |
|---|---|
| True Positive | Instances that are correctly predicted as positive |
| True Negative | Instances that are correctly predicted as negative |
| False Negative | Instances that are falsely predicted as negative |
| False Positives | Instances that are falsely predicted as positive |
| Precision | The number of positive instances predicted correctly out of all the predictions made by the model |
| Recall | The number of positive instances predicted correctly by the model out of all the positive instances in the test set |
| Specificity | Measures the number of negative instances predicted correctly out of all the predictions |
| Sensitivity | Measures the number of positive instances predicted correctly out of all the predictions |
| F1 Score | It is calculated as the harmonic mean of Specificity and Sensitivity |
| ROC AUC Score | Captures the ability of a predictive model to distinguish between the different classes of the output variable at different classification thresholds |
Final accuracy metrics for the tuned Gradient Boosting Classifier (GBC):
| METRIC | VALUE |
|---|---|
| ROC AUC Score | 78% |
| Accuracy | 89% |
| F1 Score for Class 0 | 94% |
| F1 Score for Class 1 | 32% |
| True Negatives | 11,745 |
| True Positives | 342 |
| False Negatives | 1,245 |
| False Positives | 232 |
| Precision For Class 1 | 60% |
| Recall For Class 1 | 22% |
| Precision For Class 0 | 90% |
| Recall For Class 0 | 98% |
Inferences:
The overall model accuracy is 89%, with an ROC AUC score of 78%. This indicates that the model correctly classifies instances 89% of the time overall, though its capability to differentiate positive from
negative instances is lower at 78%. Specifically, the model predicts negative instances ('no' class) with high precision (90%) and recall (98%), resulting in an F1-score of 94% for negative instances.
However, the positive class predictions show limited performance, with only 60% precision and 22% recall, leading to a lower F1-score of 32%.
Thus, while the overall performance is robust, the model struggles significantly with accurately predicting positive instances.
8. Recommendations
This dataset offers a suitable opportunity to explore resampling and oversampling techniques to address class imbalance. Methods such as Synthetic Minority Oversampling Technique (SMOTE) [7] could be beneficial for generating synthetic minority class data by analyzing existing data distributions. Although SMOTE could potentially introduce noise, careful parameter tuning can mitigate this issue, allowing for improved positive class predictions.
9. Lessons Learned
One critical lesson from this project is the importance of effectively managing class imbalance, as evidenced by the model’s difficulty in predicting positive instances. Another significant takeaway is the necessity of careful handling and management of missing data to ensure that crucial information is preserved for model training and prediction.
10. Conclusions
- • Effective marketing strategies are vital for business growth and customer outreach.
- • Thorough marketing research and strategic planning significantly contribute to generating revenue.
- • Utilizing advanced analytical technologies can enable businesses to develop cost-effective and efficient marketing strategies.
- • Companies can gain profound insights into their products and customer behaviors through detailed analysis of sales and marketing data.
11. Citations
- 1. Dataset - https://archive.ics.uci.edu/ml//datasets/Bank+Marketing#
- 2. S. Moro, P. Cortez, and P. Rita. A Data-Driven Approach to Predict the Success of Bank Telemarketing. Decision Support Systems, Elsevier, 62:22-31, June 2014
- 3. https://scikit-learn.org/stable/modules/generated/sklearn.ensemble.GradientBoostingClassifier.html
- 4. https://scikit-learn.org/stable/modules/generated/sklearn.linear_model.LogisticRegression.html
- 5. https://scikit-learn.org/stable/modules/generated/sklearn.ensemble.RandomForestClassifier.html
- 6. https://scikit-learn.org/stable/modules/generated/sklearn.model_selection.train_test_split.html
- 7. https://towardsdatascience.com/smote-fdce2f605729